


The content of this post, or any post in Stumbling About, is for informational purposes only and does not represent investment advice. My investing style is fairly aggressive, and suits my own personality and psychology…it may not suit yours. You should do your own research before using any of the information that I share, and especially before investing.
Hello, all. Welcome to the investing part of my brain.
Public market investing has been a part of my life for nearly 20 years, and it has taken on a few different shapes during that time. I started as a value investor, and learned a lot about market fundamentals. But that didn’t stick. I get revved up by growth, love storytelling, and thrive off of big wins — that doesn’t naturally vibe with classic value investing.
Thus, I began momentum investing, including some day trading for awhile. I learned a lot about the movement of the markets and technical analysis. In the end, that didn’t stick either. Investing based on short term performance (< 1 year) doesn’t fit with my core belief in the power of flywheels, and it doesn’t feed my need (nay, desire!) to understand companies at their core.
So, as usual, I created something new. I developed a series of algorithms that are based on an investing factor that I call Long Trend Momentum1: concentrated investments in public companies that are early into a proven flywheel.
Concentrated investments = no more than a handful of new investments in any given year (technically, up to 6, but handful sounds better)
Public companies = publicly traded on a major US stock exchange (no OTC, please)
Early = there’s still gas left in their tank of returns
Proven flywheel = At least 5 years public (no IPOs), and have returns that have materially beaten the overall market, as well as similarly-aged peers, over nearly every period in their public life
I’ve endearingly named my investment model “Farfin.” Why Farfin? Why not? Would an investment model by any other name produce market-beating results just as sweet? :)
This post walks through the baseline thought processes of how I came up with Farfin. It’s a long post, and investing wonks should enjoy it. For everyone else, here’s the too long didn’t read:
Farfin’s algorithms:
Pick up to a handful of equities2 to buy each year that have consistently beaten the market over time, and are showing strong current momentum in their stock returns
Provide a proxy for the top of very frothy markets (it has historically triggered in 1973, 1987, 2000, and 2008)
Provide a proxy for the bottoms of the crashes that come from those market tops
Investments happen only once per year, at the start of the year. This is not a high frequency trading strategy, but rather an investing strategy. I want to take as much of the human (me in this case) out of the micro decision making of Farfin, and leave my job as only executing the trades and adjusting the macro strategy as needed (hopefully not often)
I’m quite pleased with the backtesting results. Farfin’s market-beating returns begin in the 1960s. I can prescribe this to the fact that the 1960s is when participation/liquidity in the US markets became real, making momentum (Long Trend or otherwise) a viable investment factor. Looking at the 50 years between 1970 to 2019 (choosing those dates because 50 years is an even, good sounding number), here’s a summary of results:
Cumulative Performance Relative to the Market: 31x the market
Compound Annual Growth Rate (CAGR): 19.8%
For the investing nerds among us, buckle up, and get ready to read about:
The algorithms behind Farfin
Farfin’s investing mechanics
50-year backtesting results for Farfin
The algorithms behind Farfin
And the meat begins. Below are descriptions of the algorithms that pick the stocks to buy and sell, proxy market tops and proxy market bottoms. I try to go into enough detail that you can understand my thought process, but stop before it gets too proprietary. Apologies for not divulging all secrets, but…
Buying and selling equities
The primary algorithm behind Farfin chooses the equities (including both individual stocks and ETFs) to buy and sell in any given year. As mentioned, equities are only considered if they have been public for at least 5 years, and are traded on a major US stock exchange. Assuming these hold true, each year stocks must then make it through two filters: a consistency filter and a momentum filter.
Picking stocks to buy
Consistency filter
The consistency filter is designed to find stocks that have performed above the market consistently over the lifespan of the equity (up to the last 20 years3).
To determine consistency:
Each year I take the total number of years that a stock has existed (with a max of 20 years) and split those years into 5 periods (e.g., if a stock has been around for 15 years, then each period would be 3 years long).
Then I look at the stock’s ratio of returns relative to both the overall stock market, as well as a high performing group of stocks4 that have been public for roughly the same amount of time as each stock.
To pass this filter, a stock must beat both the market, and the the high performing peers, in over 70% of these periods. ← consistency
This is not an easy filter to pass: of the 33,580 stocks analyzed, 1,210 have ever passed this screen (3.6% of all stocks analyzed).
Momentum filter
The momentum filter is a cousin of the consistency filter, and is used to highlight companies that have not only shown that they can perform over time, but also that they are performing very strongly now.
To determine momentum:
Each year, I split all stocks into one of 5 different performance categories — from best to worst performance, those categories are: Super, Star, Strong, Average, and Laggard.
In order to determine an equity’s category, I look at prior performance relative to the market over the prior 1 year, 3 year, 5 year, and 10 year periods (remember, Long Trend).
That performance track record will earn a certain number of “points” for each stock, which determines its category.
Only stocks that are classified as either Super or Star stocks pass the consistency filter for investment in a given year.
Only 205 stocks have ever passed through both the consistency and momentum filters in a given year (0.6% of all stocks analyzed). Farfin runs an exclusive club.
Picking equities to sell
This section is short and sweet because Farfin only offloads equities in two scenarios: underperformance and overperformance.
Underperformance
If an equity falls into the lowest performing category (i.e., a Laggard according to the momentum filter above) for just 1 year, then I sell it (ruthless, I know).
Overperformance
If an equity reaches cumulative returns of 35x+ the market, then I sell it. I’ll be forever grateful for the fruits of its labor, but the time has come to bid adieu.
Note that this is only a sell point based on returns relative to the market, not percent of the portfolio. The portfolio can get pretty concentrated as a result, which you’ll see later.
Also, all stocks not flagged for a sell remain in the portfolio.
Proxying market tops and bottoms
First, let me say this: timing the market is a bad idea, and it can’t be done sustainably over time.
Next, let me say this: the algorithms I developed have a pretty solid prediction history in backtesting, and I’m excited to give them a go in real time.
May the odds be ever in my favor.
Market tops
What makes a market not just fall…and not just correct…but crash? No one knows. However, I’ve read a lot about the US stock market crashes of the Great Depression (1929), the Stagflation era (1970s), the Dot-com Bubble (early 2000s), and the Great Financial Crisis (late 2000s); and I have a hypothesis.
As to not let all this reading go to waste, I sat down and contemplated the essence of a crash (as one does). And here’s where I landed:
The events that are typically blamed for multi-year market crashes — bankruptcies, rising interest rates, rising inflation, market concentration, anti-trust lawsuits, etc. — happen in some flavor nearly all the time, not just before crashes.
Therefore, it’s not about the events themselves, but rather about the conditions of the market at the time at which the events occur.
If the markets are in a “normal” condition when these events occur, then all is generally well…we might get a short term correction or some panic, but it’ll sort out relatively quickly — Q4 2018 and Q1/Q2 of 2020 are recent examples of this.
However, if the markets are in too fragile of a state, then…well…no bueno.
So then, I needed to figure out how to think about market fragility.
With a fragility lens, what stood out to me with all the above market crashes is that, in each, the market literally got way ahead of itself — meaning that the performance of the overall stock market far outpaced the performance of the individual stocks within the market5.
This situation is TINA (There Is No Alternative) at its finest. When market performance is more evenly distributed (not evenly, but more evenly), then when some stocks fall out of favor, there are other stocks to pick up the load. However, when market performance is held by a relatively small number of stocks, and those stocks fall out of favor, then investors bear the brunt of that collapse because TINA becomes quite literal.
I kept pulling on the thread of that insight, and decided to quantify it. That quantification is my market top proxy algorithm.
Here is the output from 1960+:

On the graph above, anything about a 1.0 indicates that this year represented a top that wouldn’t be seen for multiple years.
Next, I cleaned up to data to assume that once 1.0+ was reached, the clock would reset. Here’s that output (pop years highlighted red):
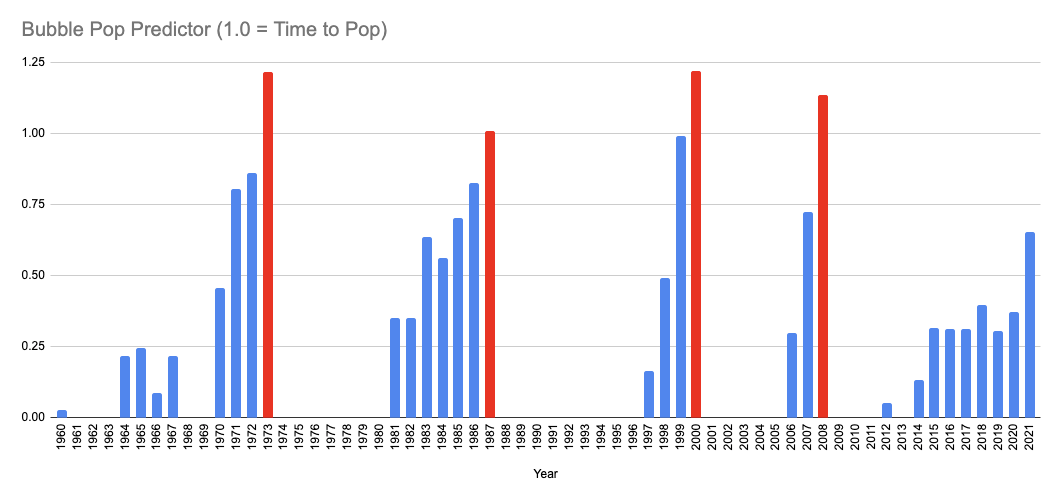
The indicator flagged in 1973, 1987, 2000, and 2008 — all years of major market crashes, a promising sign.
So where are we currently, you ask? As you can see in the above, the start of 2021 showed a material uptick, but not at 1.0 quite yet. As I write this, 2021 has continued the rally, so I imagine there will be another material uptick at the start of 2022.
Will it get to 1.0? Will that prove to be the timing of another pop? Only the Shadow knows…
Market bottoms
For proxying market bottoms, I looked for:
Indicators of strong slowing negative momentum in the months/years after a bubble pop; and
A 20% buffer of market recovery on the other side of that slowing momentum (safety first).
I’m skipping a chart for this one, but after quantifying my approach, the algorithm spit out market bottoms (plus 20% recovery) in February 1975, June 2003, and May 2009.6 Actual S&P 500 market bottoms during these times were September 1974, September 2002, and February 2009. Not bad.
So it didn’t hit the market bottoms during these times exactly, and I wouldn’t expect it to, but as a proxy it’s pretty darn close.
The mechanics of investing with Farfin
Monthly vs. annual investments
Alright, so we’ve covered the algorithms that go into making Farfin run. Now, for a little more execution detail.
When I first programmed Farfin7, I used a monthly investment cadence — investing over an entire calendar year in whatever equities flag for that year, with an equally distributed set of monthly contributions. Specifically, the model backtesting assumed $10,000 invested up front, with $1,000 invested in each month thereafter.
This approach has the “benefit” of dollar cost averaging, but also creates both executional and psychological complexity. Executional complexity comes from the need to execute trades on a monthly basis (which isn’t that complex, but does require some time investment to make happen).
Psychological complexity comes from the temptation to “go off script” when executing trades that frequently (investors need to know their own psychology, and this doesn’t play well with mine).
I decided to move to an annual investing cadence for both of these reasons: it only requires me to execute trades once a year, and psychologically I know I’m in for the ride during the year without having to press any more buttons (and backtesting showed that the risk/return for moving to annual from monthly didn’t outweigh these personal advantages).
Given this, Farfin works by determining the stocks to buy and sell at the beginning of each calendar year, and executing trades then, and only then.
Amount of investments
Contributions consist of new dollars put into the portfolio, and reinvested contributions from the selling of underperforming previous investments, overperforming previous investments, and delisted investments.
For new dollars, as mentioned above, there is an upfront investment at the start of each calendar year. In year 1 of the backtesting, this upfront amount is $21,000 (the equivalent of the $10,000 upfront + $1,000 per month in year 1 of the monthly version), and then it invests $12,000 for each subsequent year (equal to $1,000 per month in the monthly version).
Reinvested contributions come from selling underperforming stocks, overperforming stocks, and those stocks that are delisted due to acquisition, bankruptcy or similar8. When this happens, the proceeds from those sales are reinvested at the start of the following year into the stocks being invested in that year.
While the backtesting assumes an equal overall contribution per year, these contributions are not equally weighted amongst the stocks. 75% of contributions go into Super category stocks, and 25% of contributions go into Star category stocks9.
Backtesting results
Backtesting disclaimer
Backtesting results are just that, the results that come from executing on a strategy in hindsight. It is a necessary process in the creation of a strategy; however, there are inherent biases that can come during the backtesting process (e.g., Survivorship Bias and Optimization Bias).
In addition, backtesting doesn’t account for the psychology of the investor being able to execute on the trades when it comes time (e.g., riding through downturns in the market, pulling the trigger on a concentrated bet). I took great lengths to eliminate bias as much as possible (e.g., using multiple datasets to ensure no Survivorship Bias), and to account for my own psychology when creating the overall strategy. Nothing is perfect, but I did my darndest.
I felt it important to note the above, but also want to say that I have high confidence about both my bias elimination and this strategy matching my own psychology.
OK, enough disclaimer, onto the results.
Something about the 1960s
The 1960s were a special time: the Civil Rights Movement, Gilligan’s Island, JFK. However, for the purposes of Farfin, it’s also the time when my model began to work. It’s very difficult to say for sure exactly why this is the case; however, I have a strong hypothesis that it’s because the 1960s is also when participation and liquidity dramatically increased in the US stock market…and a momentum-based strategy without participation is really no strategy at all10.
Summary of results
For the purposes of this backtest, I’m going to focus on results between 1970 and 2019. In my actual backtesting, I ran results on either side of this period as well, and they are consistent with the findings outlined below. But here I’m sticking with 1970 to 2019 because 50 years is a nice round number and has a good ring to it.
Here are some topline numbers, assuming that investment started at the beginning of 1970 and continued through 2019:
Cumulative Performance Relative to the Market: 31x the market
Compound Annual Growth Rate (CAGR): 19.8%
Number of Years with a Positive Return: 40 (80% of years)
Number of Years Farfin Outperformed the Market: 30 (60% of years)
Year by year comparison to the market
Much like the most interesting man in the world, Farfin doesn’t always beat the market, but when it does….it does so in a spectacular fashion.
Here’s a year by year look at % returns for Farfin compared to the market (market = blue, Farfin = red).

It’s also important to note here that Farfin isn’t a portfolio of all winners. It’s closer to a VC fund — many of the picks lose money (though typically not down to zero like many VC picks), but the winners produce big results. This leads to material intra-year swings and drawdowns, which are not for the faint of heart.
Backtesting multiple starting years
Next, I wanted to make sure that 1970 wasn’t some magical starting year that made it all work, so I looked at what results would be if I started investing (with the amounts and cadence outlined above) in any year between 1970 and 2019. The graph below shows the ending 2019 portfolio value of Farfin vs. the market, starting in each of those years.

Good news! There isn’t a year that I could’ve started investing with Farfin and cumulatively lost to the market11.
Looking at portfolio concentration
As I mentioned, concentration is an important part of Farfin’s performance. Below is a chart showing the number of stocks held per year with a 1970 investment start, as well as a glimpse into my 2020 Farfin holdings so that you can see a specific example of portfolio concentration.

The median number of stocks held in the Farfin portfolio during this time would have been 12, with the maximum number held being 21.
And here’s the 2020 Farfin stock concentration:

Putting Farfin into action
So, what’s next?
I started investing with Farfin in Q4 of 2019, so it’s very early in the real life trial run. I’ve made a few important tweaks to strategy since then (those tweaks are reflected in this post), and so far so great.
2020 was the first full year of usage and brought in a 46% return. But one year does not a proven strategy make — it’s going to take a few years to be able to compare real life performance to backtest performance, but this is promising.
The strategy suits my psychology quite well:
It fits my flywheel belief and approach
I get to go deep into companies, and ride along with winners over multiple years
And I can deal with the intra-year swings (i.e., drawdowns).
It works for me, and that’s one of the most important tenants of good investing, finding a strategy that works for you and your personal psychology.
Soon, I’m going to begin posting my quarterly portfolio results (starting with Q3 2021) for others to follow along. This will include both the Farfin portfolio, as well as other picks that I make on the side (other picks are a minority of my portfolio, but might be fun to discuss nonetheless). As always, this for informational purposes only, and is by no means investment advice…in fact, Farfin wouldn’t fit the psychology of the vast majority of investors.
Until then, I hope you enjoyed reading this, and happy investing!
The content of this post, or any post in Stumbling About, is for informational purposes only and does not represent investment advice. My investing style is fairly aggressive, and suits my own personality and psychology…it may not suit yours. You should do your own research before using any of the information that I share, and especially before investing.
Typically, momentum investing looks at shorter-term time horizons like price movements over the last 1, 3, or 12 months. With Long Trend Momentum, I’m looking at price movements up to the last 20 years.
I use the terms equities and stocks interchangeably throughout the post. There’s no differentiated meaning between my use of each.
I chose the last 20 years rather than the complete public market life of stocks in order to account for different performance periods that a stock might have (i.e., what a stock did in the 1940s or 1970s may not have much impact on the company that trades today).
High performing is defined by beating the market by at least 3x over a given period.
A little more on what I mean here. At the start of all of the rallies that preceded these crashes, many of the stocks in the market were performing well. However, at some point that shifted, and the high performing stocks that propped up overall market returns became the minority. So the market was still doing well overall, but that wasn’t representative of most of the stocks within it.
You’ll note that there’s no bottom represented for 1987. 1987 qualified as a multi-year market crash; however, the crash happened so quickly (Black Monday, anyone?) that my algorithm didn’t pick up a bottom. Alas.
Farfin is built primarily in Ruby, with a soupçon of Python, for those interested.
Delisted stocks are those investments that were previously listed on a major US exchange and no longer are.
If only Super or only Star stocks qualify in a year (i.e., Super stocks but not Star stocks, or vice versa), then 100% of funds will go toward the qualifying category. There were a small number of years when no stocks qualified, in which I put all of that year’s contributions into an overall market fund.
After the crash of 1929, interest and participation in the stock market waned. Confidence in the market didn’t start to come back until the market once again reached its 1929 price peak in 1954. This confidence continued through the 1960s (and beyond, of course). The 1960s also corresponds with Fidelity beginning to market mutual funds to the broad public (versus just the wealthy), which also increased participation and liquidity.
I’m including only this look for simplicity of the post, but I tested many other periods as well — including looking at 5 year, 10 year, and 20 year return periods relative to the market; and, of course, periods that don’t end in 2019. These tests increased my confidence in Farfin.